Menu

Currency

BRICS-backed bank plans first Indian rupee-denominated bond by end-March

BRICS-backed bank plans first Indian rupee-denominated bond by end-March

BRICS-backed bank plans first Indian rupee-denominated bond by end-March

In a significant move towards enhancing the international presence of BRICS currencies, the New Development Bank (NDB), established by Brazil, Russia, India, China, and South Africa, plans to issue its debut rupee-denominated bond in the domestic Indian market by March 2026.. This initiative aims to raise between $400 million and $500 million through 3- to 5-year bonds.

Strategic Objectives
The NDB’s decision to issue rupee-denominated bonds aligns with its strategy to increase local currency lending among BRICS nations. The bank aims to provide 30% of its financial commitments in member countries’ national currencies by 2026. This move is also part of broader efforts to promote the international use of BRICS currencies and reduce reliance on the U.S. dollar in global trade and finance. The planned issuance comes after previous fundraising efforts in Chinese yuan and South African rand. The NDB is in advanced discussions with the Reserve Bank of India (RBI) for final approvals, although it remains unclear if full government consent has been secured.

Market Conditions and Currency Dynamics
As of May 2025, the Indian rupee was trading at approximately 85.27 per U.S. dollar, reflecting a modest strengthening against the greenback. This favorable exchange rate could enhance the appeal of rupee-denominated bonds to international investors, potentially leading to increased demand and favorable pricing for the upcoming NDB issuance.

Potential Impact on Indian Financial Markets
The NDB’s debut rupee bond is expected to boost liquidity and investor interest in India’s bond market. Similar instruments from institutions like the World Bank’s International Finance Corporation (IFC) have historically seen strong investor interest, indicating a positive reception for such offerings. Additionally, the issuance aligns with the Reserve Bank of India’s efforts to manage liquidity in the banking system. In February 2025, the RBI announced a $10 billion three-year dollar/rupee swap auction to address ongoing cash shortages, infusing approximately 870 billion rupees into the system. The NDB’s bond issuance could complement these efforts by providing an alternative investment avenue and contributing to overall market stability.

Investor Considerations
Investors should monitor the NDB’s bond issuance closely, as it represents a novel opportunity in the Indian fixed-income market. Key factors to consider include:
* Credit Rating: The NDB’s creditworthiness will influence the bond’s risk profile and yield expectations. Investors should assess the bank’s financial health and historical performance.
* Currency Risk: While the bond will be denominated in Indian rupees, the NDB’s international backing may mitigate some currency risk. However, fluctuations in the rupee’s value against other currencies could impact returns.
* Market Demand: The level of investor interest in the NDB’s bond will affect its pricing and yield. A strong demand could lead to favorable terms for the bank and investors alike.
* Regulatory Approvals: Final approval from the RBI and the Indian government is crucial for the issuance. Delays or changes in regulatory conditions could impact the timeline and structure of the bond.

Conclusion
The NDB’s plan to issue its first Indian rupee-denominated bond marks a significant step in promoting the international use of BRICS currencies and diversifying investment opportunities in India’s financial markets. While the initiative holds promise for enhancing liquidity and investor interest, potential investors should carefully evaluate the associated risks and monitor developments related to regulatory approvals and market conditions.


The image added is for representation purposes only

Balanced Portfolio in a Volatile Era: How to Allocate in Late 2025

Rupee Surge and the RBI Hold: What It Means for Indian Investors

Rupee Surge and the RBI Hold: What It Means for Indian Investors

Rupee Surge and the RBI Hold: What It Means for Indian Investors

On October 1, 2025 the Reserve Bank of India’s Monetary Policy Committee kept the policy repo rate unchanged at 5.50% and retained a neutral stance, while revising its real GDP forecast for fiscal 2025–26 upwards to 6.8% and trimming inflation projections. The decision was framed as a “dovish pause” that balanced upside growth revisions against still-benign inflation signals. The same day, the Indian rupee delivered its strongest simple daily gain in two weeks, closing around ₹88.69 per USD, as the U.S. dollar weakened amid geopolitical and US-political uncertainty. Indian equity indices also responded positively, with the BSE Sensex and Nifty 50 up roughly 0.9% on the day.

Why the RBI hold matters for markets
A central bank decision to pause (rather than hike) does more than freeze borrowing costs — it signals the path of future policy and affects risk appetite. By holding at 5.50% while revising growth upwards, the RBI has telegraphed that inflation is under enough control to allow a lenient stance if growth needs support. For investors this means:
* Equities: A neutral stance plus stronger growth forecasts typically supports higher earnings expectations for cyclical sectors (private consumption, banking, capital goods). The immediate market reaction — a near 1% rise in headline indices — reflects this linkage.
* Fixed income: Hints of future easing can pressure bond yields lower over time, but in the short run yields rose: India’s 10-year G-sec yield moved to the mid 6.5% area (around 6.52–6.59% on Oct 1), reflecting recent supply and global yield dynamics. That rise suggests spillovers from global rates and near-term liquidity rather than domestic policy surprise alone.
* FX: The rupee’s modest bounce was aided more by a softer U.S. dollar and potential RBI intervention than by a structural reversal. The central bank’s willingness to stabilise FX via state-bank dollar sales (if necessary) remains important given India’s open-economy exposures.

The rupee move — temporary reprieve or trend change?
The rupee’s ₹88.69 close on October 1 marked a technical recovery after a run of losses, but several factors argue caution before calling a structural reversal. First, India’s trade balance and dollar demand from importers and oil bills remain material; second, global dollar strength and yields set the backdrop for capital flows. ANZ and other banks flagged that a gradual depreciation remains a reasonable baseline absent large positive external shocks. Therefore, investors should treat the October 1 rally as a stabilising move, not definitive appreciation.

Sector and portfolio implications — practical takeaways
* Banks and financials: A neutral RBI stance plus growth upgrades typically favour loan growth and credit demand. Banking stocks often lead short-term rallies, but watch net interest margin (NIM) sensitivity to future rate cuts. If the RBI moves to ease later, NIM compression is a medium-term risk; however, higher loan volumes may offset some margin pressure.
* Exporters & IT services: Exporters benefit from a stable or weaker rupee. A sharper rupee depreciation supports reported rupee revenue for US-dollar earners; conversely, a strengthening rupee can compress margins. Given the RBI’s interventions and global dollar drivers, exporters should hedge near-term FX exposures selectively.
* Defensive consumer and domestic plays: Stronger growth forecasts support consumption themes—FMCG, retail and autos—but margin pressure from input inflation remains the watchpoint.
* Fixed income investors: With 10-year yields near 6.5–6.6%, investors must weigh duration risk versus yield pick-up. Shorter-dated government papers and dynamic bond funds offer ways to capture yields if the market expects eventual easing. Institutional investors should watch primary G-Sec supply calendars and CCIL indicative yields for yield curve shifts.

Risks and what to monitor next
Investors should track: RBI forward guidance — any explicit timing for cuts; inflation prints month-by-month to confirm the 2.6%/lower inflation trajectory the RBI signalled; external flows (FPI flows) and the US dollar index (which was ~97.6 on Oct 1) because global liquidity will dominate FX moves; and 10-year G-sec yields which set borrowing cost expectations for corporates. Market participants should prepare for volatility around US macro and political developments that have outsized short-term FX and rate implications.

Conclusion
The RBI’s October 1, 2025 hold with an upward GDP tweak provides a constructive backdrop for growth-oriented allocations in India, but the rupee’s bounce looks tactical rather than decisive. Prudent investors should overweight cyclicals and credit plays that benefit from growth if valuations permit; hedge significant FX exposure in export/import business models; and manage duration in fixed income, balancing attractive mid-6% yields against potential policy and supply shocks. The central bank bought markets a moment of clarity; the coming weeks of data and global sentiment will determine whether that clarity becomes a durable trend.


The image added is for representation purposes only

Activist Investors on Overdrive: The 2025 Surge in Corporate Campaigns

Safe Havens in 2025: Gold, Yen and Alternatives in a Volatile Year

Safe Havens in 2025: Gold, Yen and Alternatives in a Volatile Year

Safe Havens in 2025: Gold, Yen and Alternatives in a Volatile Year

2025 has been an unusually intense year for so-called safe havens. Geopolitical tensions in multiple theatres, a U.S. government shutdown and fresh doubts about the path of Fed policy combined to weaken the U.S. dollar and raise recession-risk concerns. That mix has pushed traditionally defensive assets — most notably gold — into the spotlight as investors seek protection from policy uncertainty and market volatility. The U.S. Dollar Index (DXY) traded around 97.7 in early October, down from stronger levels earlier in the year, a move that made dollar-priced bullion more attractive to non-U.S. buyers.

Gold: record highs and the mechanics behind the rally
Gold has been the clearest beneficiary. Spot gold surged to record territory in late September and early October 2025, peaking near $3,895 an ounce on October 1, 2025 — a year-to-date gain commonly reported in the range of 40–47% depending on the reference date. The drivers are multi-fold: rising expectations of U.S. rate cuts, central bank purchases, ETF and retail demand, and safe-haven flows triggered by geopolitical risk. Analysts and major banks have revised target frameworks: some put a baseline of $3,700–$4,000 for end-2025 under a benign scenario and warn that stronger ETF inflows or continued dollar weakness could push prices higher. From a market-structure angle, global gold ETF assets and flows matter because paper demand translates into physical draw on inventories and bullion swaps. In 2025, gold ETF assets surged (reports show large cumulative inflows year-to-date), amplifying the price impact of incremental buying. That combination of cyclical flows (investors) and structural demand (central banks) underpinned the extraordinary run.

The yen and other currency havens: limited but real shelter
Currencies traditionally viewed as havens — the Japanese yen among them — have behaved differently this year. The yen has shown bouts of strength, trading in the mid-140s to upper-140s USD/JPY in late September–early October 2025, after earlier weakness. Yen moves are sensitive to cross-border flows and Japan’s own policy signals: a sudden risk-off episode can see safe-haven buying of the yen even against a backdrop of domestic monetary easing. Investors should note that currency havens are less pure than gold: their moves reflect rate differentials, central bank interventions and capital-flow technicals, so yen strength can be transient even during risk aversion.

Alternatives: sovereign bonds, silver and digital assets
Sovereign debt — especially U.S. Treasuries — remains a classic refuge. The U.S. 10-year Treasury yield traded near ~4.1% in early October, down from higher intrayear peaks as expectations for Fed easing rose; higher absolute yields, however, complicate the “safe” narrative because they also reflect inflation and fiscal dynamics. Lower yields typically support gold (via a lower opportunity cost of holding non-yielding bullion), but a simultaneous flight to Treasuries can coexist with a gold rally when risk sentiment swings sharply. Silver has outperformed even gold in 2025 percentage-wise, driven by both investor speculation and tight industrial supply conditions; the narrowing gold-silver ratio this year signals elevated industrial demand alongside pure store-of-value flows. Digital assets (notably Bitcoin) have intermittently shown correlation with gold during risk moves, attracting allocators who treat crypto as a complementary hedge, albeit with much higher volatility.

Practical implications for investors and portfolio construction
* Hedging vs. speculation: Gold is principally a hedge against systemic risk and currency debasement; investors should size exposures according to portfolio objectives—typical tactical allocations range from 2–10% depending on risk tolerance. Use physical bullion, ETFs, or futures depending on custody, liquidity and tax considerations.
* Interest-rate sensitivity: Monitor real yields. Gold tends to rally when real yields fall (rate cuts or easing inflation expectations); conversely, rising real yields can cap gold’s upside. With the U.S. 10-year around 4.1%, the path of Fed policy is a central pivot for further moves.
* Currency exposure management: For exporters and multinational investors, currency hedges are essential. The yen can provide episodic shelter, but it is not a permanent safe haven if Japan’s policy or intervention changes.
* Liquidity and timing: Safe-haven assets can spike quickly and reverse. Active risk management and clear exit rules (stop-losses, profit-taking bands) protect investors from sharp mean reversions.

Conclusion
2025 has underscored that “safe haven” is a behavioural label as much as an asset class. Gold’s record run — supported by ETF flows, central bank buying and a softer dollar — has made it the year’s marquee haven. Currencies like the yen, sovereign bonds and even silver and cryptocurrencies can play supporting roles, but each comes with distinct drivers and tradeoffs. For investors, the lesson is pragmatic: maintain modest, well-documented allocations to trusted havens, actively monitor real yields and dollar dynamics, and treat any short-term surge as an opportunity to reassess—not to abandon—longer-term risk management frameworks.


The image added is for representation purposes only
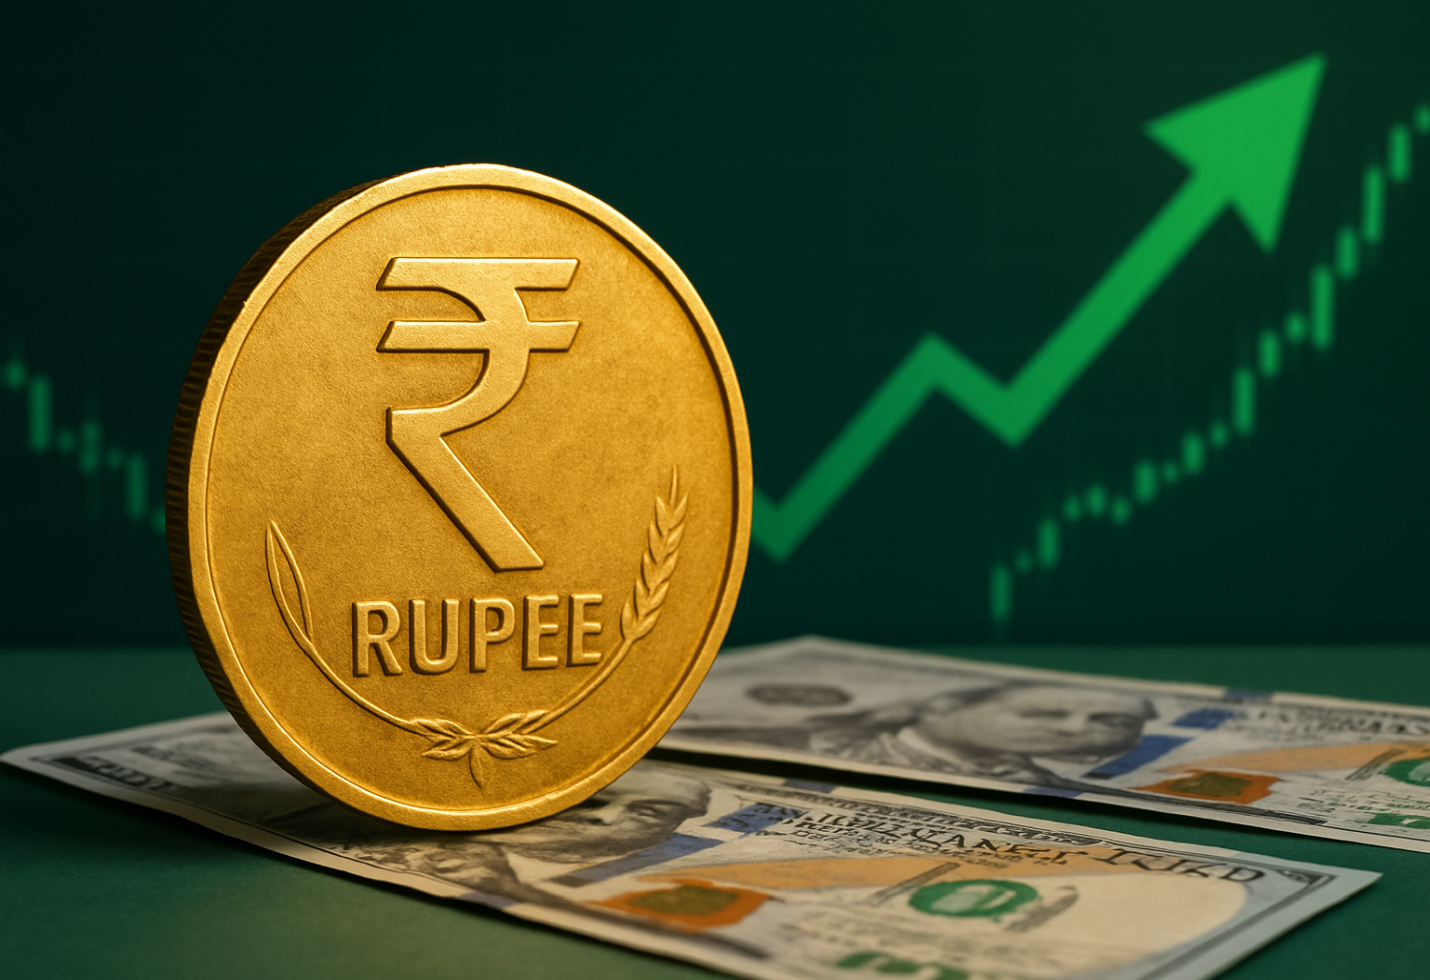
How India’s Fiscal & Monetary Settings Are Shaping Investment Flows

BRICS-backed bank plans first Indian rupee-denominated bond by end-March

Rupee Plummets Amid FII Outflows, Trade Concerns

Rupee Plummets Amid FII Outflows, Trade Concerns

Foreign fund withdrawal and global trade uncertainty have dragged the Indian rupee to a record low, stoking inflationary fears and complicating the monetary policy outlook.

Summary:
The Indian rupee fell sharply on Tuesday, decreasing by 47 paise to end the day at 85.87 compared to the U.S. dollar. This decline was driven by significant outflows from foreign institutional investors (FIIs) and rising global concerns over trade tariffs. This marked one of the steepest single-day declines in recent months and raised alarms across India’s financial and policy-making circles as the currency approached uncharted territory.

Rupee Cracks Under Pressure, Hits Record Low of 85.87/USD
On Tuesday, the Indian currency experienced a significant drop, falling by 47 paise to finish at ₹85.87 per U.S. dollar, which stands as one of its lowest closing values on record. The sudden fall in the rupee was attributed to a combination of foreign fund outflows, global risk-off sentiment, and uncertainties surrounding trade tariffs, particularly those being imposed and revised by major economies such as the U.S. and China.
According to dealers in the foreign exchange market, the rupee opened weak at ₹85.42 and continued to lose ground throughout the trading session amid persistent dollar demand from oil importers and corporates. The Reserve Bank of India (RBI) was reported to have intervened during the day to stabilise the fall but refrained from significant dollar selling.

Global Trade War Fears and Tariff Uncertainty Weigh Heavy
The rupee’s depreciation comes at a time when global trade tensions are rising once again. With the U.S. mulling increased tariffs on Chinese electric vehicles, steel, and semiconductor components, global investors are growing wary of a full-blown trade war resurgence. These concerns have prompted many investors to exit emerging markets, including India, and shift capital into safer assets like the U.S. dollar and treasury bonds.
Moreover, the recent strengthening of the U.S. dollar index (DXY) to levels above 106 has created added pressure on currencies across Asia. The rupee is not alone in its struggle; most Asian currencies, including the Thai baht, Indonesian rupiah, and Malaysian ringgit, also saw steep declines during the week.

FIIs Pulling Out Capital: Key Reason Behind the Slide
One of the core drivers behind the rupee’s fall has been sustained foreign institutional investor (FII) outflows. As per information from the National Securities Depository Ltd (NSDL), foreign institutional investors (FIIs) have offloaded more than ₹9,200 crore in Indian equities during the past five sessions. The outflows are primarily being driven by:
Concerns over elevated U.S. interest rates, making American assets more attractive
Weakening global growth outlook
Profit booking ahead of quarterly earnings and geopolitical tensions
The resultant capital flight has pressured the domestic currency, especially in the absence of meaningful FDI (foreign direct investment) inflows during this period.

Oil Prices and Importer Demand Add to the Burden
Crude oil prices have remained elevated, hovering around $84–86 per barrel, largely due to supply restrictions from OPEC+ and geopolitical unrest in the Middle East. India, being a net importer of oil, experiences added fiscal pressure when global oil prices rise.
The increase in oil import bills leads to greater demand for dollars by Indian oil companies, which further weakens the rupee. Dealers mentioned that oil-related dollar demand intensified in the latter half of the day, pushing the rupee down even further toward the close.

Inflation and Monetary Policy Concerns Resurface
A weaker rupee also raises the spectre of imported inflation, especially in food, fuel, and electronics. This puts the RBI in a challenging position, as it tries to strike a balance between controlling inflation and supporting growth.
While the RBI has maintained a pause on interest rate hikes over the past quarters, the current currency depreciation could compel the central bank to adopt a more hawkish tone or intervene more aggressively in the forex markets to maintain macroeconomic stability.

Market Reactions and Expert Commentary
Traders and economists alike expressed concern over the sharp fall.
“The rupee’s fall below 85.80 is a psychological breach. Continued pressure from global cues and lack of inflows could see the rupee touch 86.10 in the near term unless the RBI steps in decisively,” said a forex strategist from a private bank.
Market players are keenly observing the forthcoming statements from the U.S. Federal Reserve, as they may provide insights into potential future interest rate decisions. Any hint of prolonged high interest rates in the U.S. could trigger more FII selling and further pressure the rupee.

Outlook: Can the Rupee Rebound?
Whether the rupee stabilises or weakens further will depend on a mix of domestic and global factors:
RBI’s intervention strategy
Direction of U.S. bond yields
FII behaviour ahead of earnings season
Clarity on global trade tariffs
A stable monsoon and cooling domestic inflation could offer some comfort. However, if geopolitical risks escalate or oil prices rise sharply, the rupee could see further downside in the short term.

Conclusion
The rupee’s plunge to ₹85.87 against the U.S. dollar signals brewing tension in India’s macroeconomic landscape. As foreign investors pull back, oil importers seek more dollars, and global uncertainties mount, the pressure on the currency is likely to persist in the near term. Policymakers and investors will now watch closely for signs of stabilisation or further volatility as India navigates a turbulent global environment.


:


The image added is for representation purposes only

Kalyan Jewellers’ Q1 Revenue Shines, but Share Price Dips

Z47 Launches $400M Fund for India's Tech Boom

Indian Currency Slips: May Test ₹87 Mark Amid Worldwide Instability

Indian Currency Slips: May Test ₹87 Mark Amid Worldwide Instability

The Indian rupee is under significant pressure due to rising global tensions, surging crude oil prices, and strong corporate demand for the US dollar. Currency experts believe the rupee could soon breach the crucial ₹87 per dollar level if these conditions persist. The combination of geopolitical risks and India’s dependence on energy imports has made the domestic currency highly vulnerable in the current scenario.

Geopolitical Tensions Drive Rupee Weakness

The recent escalation of the Israel-Iran conflict has created global uncertainty, pushing investors to shift their capital into safe-haven assets like the US dollar. This move has weakened several emerging market currencies, including the Indian rupee. The rupee has been on a continuous downward path in recent weeks, declining from ₹85.60 in the beginning of June to ₹86.72 by June 19, 2025.This sharp decline marks the rupee’s weakest point in nearly three months.

Experts caution that if the geopolitical tensions worsen or if the conflict spreads further, the rupee may break past the ₹87 mark. The ongoing instability has already led to concerns about the supply of crude oil, a commodity India heavily relies on.

Oil Prices Continue to Push Import Costs Higher

India is particularly sensitive to fluctuations in crude oil prices, as the country imports around 85% of its energy needs. The ongoing tensions in the Middle East have driven crude oil prices higher, with Brent crude nearing $79 per barrel recently. Analysts have warned that a $10 per barrel rise in crude oil prices could increase India’s current account deficit by approximately 0.3% to 0.4% of GDP.

A wider trade deficit forces India to spend more foreign currency on oil purchases, further increasing the demand for dollars and pushing the rupee down. The Indian rupee is likely to remain under stress as oil prices hold at higher levels.


Increased Dollar Demand from Indian Corporates

Apart from geopolitical concerns, the rising corporate demand for dollars is also contributing to the rupee’s weakness. Several Indian companies are actively purchasing dollars to cover their import payments and hedge against further rupee depreciation. This has created a strong demand for dollars within the domestic market.

The situation is further complicated by foreign investors pulling out funds from emerging markets amid growing global uncertainties. With capital outflows intensifying, the rupee faces additional downward pressure, increasing the likelihood of breaching ₹87 per dollar.

RBI Likely to Monitor and Intervene if Needed

The Reserve Bank of India (RBI) generally allows the rupee to move in line with market forces, but the central bank has a history of stepping in if volatility becomes excessive. With over $699 billion in foreign exchange reserves, the RBI is well-positioned to intervene if the rupee’s fall accelerates beyond acceptable levels.

Analysts believe the RBI may not aggressively prevent the rupee from touching ₹87 but will act to limit sharp fluctuations that could create panic in the financial markets. The central bank’s intervention could temporarily stabilize the currency, but broader global factors will still dominate the long-term direction.

Potential Support from Upcoming IPO Inflows

One positive development that could offer temporary relief to the rupee is the upcoming large initial public offerings (IPOs) in India. The upcoming ₹1.5 billion IPO of HDB Financial Services is likely to draw significant interest from foreign portfolio investors. These inflows could help ease the pressure on the rupee in the short term by bringing in fresh dollars.

However, market participants note that such support may not last unless crude oil prices fall or the geopolitical environment improves. Unless a stable and favorable change occurs, the weakness of the rupee is likely to continue.

Near-Term Outlook: Monitoring Key Levels

According to currency analysts, the rupee is expected to fluctuate between ₹86.00 and ₹87.50 in the short term. Should the rupee firmly cross the ₹87 level, it may head towards ₹88 unless the Reserve Bank of India intervenes or new foreign investments enter the market.

Traders are also keeping a close watch on the global crude oil market, as any movement beyond $80 per barrel could trigger another round of rupee weakness. Additionally, the continuation of foreign capital outflows and persistent dollar demand from Indian corporates will further shape the currency’s trajectory.

Conclusion

The Indian rupee is currently navigating through a challenging environment dominated by external risks and domestic dollar requirements. While there are potential stabilizers like IPO inflows and RBI interventions, the overall outlook remains cautious. A further rise in oil prices or worsening geopolitical tensions could see the rupee crossing ₹87 per dollar soon. Market participants, businesses, and policymakers will need to stay vigilant as these critical factors continue to unfold.


:


The image added is for representation purposes only

Tata Motors Revamps EV Strategy to Reclaim Leadership in Indian Market

EUR/USD Drifts Lower Amid Bearish Pressure: Technical and Fundamental Drivers

EUR/USD Drifts Lower Amid Bearish Pressure: Technical and Fundamental Drivers

EUR/USD Drifts Lower Amid Bearish Pressure: Technical and Fundamental Drivers


The euro-dollar pair faces renewed selling as inflation data, technical signals, and global sentiment weigh on price action. Analysts debate whether the downtrend will persist or if a rebound is on the horizon.

Recent Price Action: Bears Take Control

The EUR/USD pair has been under steady pressure, drifting lower to the 1.1100 region with minor losses through the latest trading sessions. The move marks a retreat from recent highs around 1.1200, with the euro hitting three-day lows near 1.1130 as sellers exploited a fragile technical landscape. Despite a softer University of Michigan consumer sentiment reading, the US dollar found support from rising inflation expectations, further weighing on the euro.

Key Drivers Behind the Decline

Mixed Economic Data
• US Inflation Expectations:
The University of Michigan’s inflation forecast jumped from 6.5% to a projected 7.7%, raising the prospect of more persistent price pressures in the US. This has lent support to the dollar, as markets anticipate that the Federal Reserve may keep policy tighter for longer.
• Eurozone Trade Balance:
The eurozone’s trade surplus is forecast to shrink from €24 billion to €17.5 billion, a development that could dampen euro demand and add to the pair’s bearish tone.
• US Macro Releases:
Recent US data showed softer producer price inflation and flat retail sales, but jobless claims remained steady, keeping the dollar on relatively firm footing.

Technical Breakdown

• Support and Resistance Levels:
The pair broke below the 1.1170 Fibonacci 50% retracement, exposing further downside to 1.1080 and potentially the 1.1000 psychological level. On the upside, resistance is seen at 1.1260-1.1270 (200-period SMA), 1.1290-1.1300 (100-period SMA), and 1.1380.
• Chart Patterns:
Technical analysis points to a bearish outlook for 2025, with the pair breaking below key moving averages and struggling to regain upward momentum. The RSI hovers near 50, indicating a lack of clear direction but with a bearish tilt.

Analyst Outlook: Is a Rebound Possible?

Despite the current bearish momentum, some analysts see potential for a rebound if economic data surprises or if the dollar weakens. For example, a spike in US inflation could paradoxically drive EUR/USD higher if it leads to concerns about US growth or policy missteps. Others note that the pair remains within a broad trading range, with a possible rebound toward 1.1320 if support holds and risk sentiment improves.
Longer-term forecasts remain mixed. While some project a return to parity if bearish pressure persists, others expect the pair to oscillate in a wide range between 1.0960 and 1.1790 through 2025, with periods of both strength and weakness for the euro.

Pivot Points and Trading Levels

The current support and resistance levels for the asset indicate key price zones traders are watching closely. The third level of support (S3) is positioned at 1.1040, while the corresponding resistance (R3) lies at 1.1283. The second support level (S2) stands at 1.1086, with resistance (R2) at 1.1255. Moving closer to the current market range, the first support level (S1) is at 1.1115, and the immediate resistance (R1) is at 1.1220. The pivot point, which often acts as a balance marker between bullish and bearish momentum, is calculated at 1.1161. These levels serve as critical indicators for potential price reversals or breakouts in the trading session.
These pivot points and support/resistance levels are closely watched by traders for potential reversal or breakout opportunities.

What to Watch Next

• US Economic Data:
Key releases including housing starts, building permits, and updated consumer sentiment will shape the dollar’s direction.
• Eurozone Developments:
Political uncertainty in Germany and France, as well as trade and inflation data, could influence the euro’s trajectory.
• Technical Triggers:
A sustained break below 1.1030 could open the door to further declines toward 1.0875-1.0895, while a move above 1.1290 would suggest a bullish reversal is underway.

Conclusion

EUR/USD remains under bearish pressure as technical and fundamental factors align against the pair. While the outlook for the coming weeks is cautious, volatility is likely as traders respond to new economic data and shifting global sentiment. Both bulls and bears should remain vigilant, as the pair’s next decisive move may hinge on upcoming macroeconomic surprises and evolving market dynamics.


The image added is for representation purposes only

Eureka Forbes Springs a Surprise, Stock Soars 10%

Equity Right

How are Exchange Rates are Determined?

What determines Exchange Rates?


Exchange Rate is the value of one country’s (nation) currency against another nation’s currency. In simple terms, it is a relative value between two currencies. Usually exchange rates are free floating depending on demand and supply in market. But there are exchange rates which have restrictions and are not based on floating rate. The other factor apart from demand and supply that determines exchange rate are interest rates, speculation and market sentiment , inflation rates, etc.

Type of Exchange Rate:

Currency Peg – Sometimes a particular country’s currency peg to that of other countries currency. For example – Hong Kong’s dollar pegs to US dollar in range of 7.65 to 7.80, than value of Hong Kong’s dollar will remain between the ranges of 7.65 to 7.80.

Free floating – This rate actually fluctuates due to the change in foreign exchange market. So, if there is any fall or rise in the foreign exchange market, it will affect free floating exchange rate.

Restricted currencies – This is not applicable to all the currencies, as only some countries have restrictions which limit their exchange to be within the country’s border and have value which is set by government.

Spot and forward – Spot price is basically current market value which is also known as cash value. Similarly, exchange rate have Forward rate, which are based on the expected currency rise and fall. Forward rate changes as expected change in market value.

Onshore and Offshore – Sometimes, exchange rate differs in their own country which is because of onshore and offshore rates. This situation occurs between country’s border versus outside its borders and fluctuates accordingly. For example, Chinese government has own structure and controls the currency. By setting a midpoint value for the currency, which allows the Yuan to trade in a band of 2% from the midpoint.

Quotation – Quotation is basically an exchange rate which is quoted using an acronym for the national currency which they represent.


What determines currency exchange rate ?

Other currency determined price of one currency. Therefore various factors mainly Fixed Exchange rates, Floating Exchange Rates and Managed Exchanged rates influences Currency rate. Floating exchanges rates and Fixed Exchanges rates are most commonly used to determine rate as Floating rate actually fluctuates due to the change in foreign exchange market. So, if there is any fall or rise in the foreign exchange market, it will affect free floating exchange rate.  Demand and supply are the main factor to determine it in open market operation.

If fixed rates are used by economy than this is not applicable to all the currency, as only some countries have restrictions, which limit their exchange to be within the countries border and have value which is set by government. Countries choose to peg where, a particular countries currency peg to that of other countries currency. For example, Hong Kong’s dollar pegs to US dollar in range of 7.65 to 7.80. Than the value of Hong Kong’s dollar will remain between the ranges of 7.65 to 7.80 usually done to maintain stable rates.

Major factors which determines exchange rates are:

Government – When there is too much volatility in Forex market, then government or regulatory body of that country may intervene and buy opposite currency to control downfall. For Example, if Rupee is depreciating against Dollar with a high difference, than RBI may come forward and buy Dollars.

Imports and Exports – Imports and exports play major role in exchange rates. Therefore, government always try to maintain balance between them. For example, if imports are increasing, it create more burden on that particular country’s economy resulting in rate fluctuation.

Interest Rates – Interest rates on government bonds attracts investors, but rate should be high enough to cover foreign market risk so that investor’s money is safe and credit ratings are stable. This will result in flipping rates in particular countries exchange rate.

Speculations and Market Sentiment – When the markets are moving, there is a lot of speculation about the expected changes into the currency rates which results in investments, redemptions of foreign investors. Through speculations, investors try to earn more profit.

Inflation Rates – Any change in inflation rates results change in exchange rates. Usually, country’s which have low inflation rate have seen appreciation in their exchange rate and vice versa.

Other factors that contribute in fluctuation of exchange rates are country’s political stability, debt holdings and overall performance of economy.


Importance of Financial Literacy. Why it is a must have today

Dharani Sugars Q1 FY2026: Challenges Amid Industry Headwinds

Forex Trading vs. Regular Trading.

Forex Trading Vs. Stock Trading.


The Forex Trading and Stock Trading market:

Forex Trading vs Stocks Trading will allow you to choose the best market suitable for an investor to trade. Traders frequently compare Forex versus Stock to see which market is better for trading. Even though it is interconnected, the forex market and the stock market differ greatly. In the minds of others, the forex market has specific features that make it much more appealing to trade. If you want to trade in the market, it is important to know which trading style is the best for you. But understanding the stock and expected market variations and similarities, often helps traders to make informed trade decisions. It is based on factors such as market conditions, liquidity in the market, and size.


Comparison between Forex and Stock Market:

 Both the Forex market vs. the Stock market, have advantages and disadvantages. It comes down to the importance of these features for you personally. Let us first look at an overview of each market, and then logically deduce about Forex Market trading Vs. Stock Market trading. There is no regulator body in the Forex market and is decentralized. Forex Market represents an international trading network of members all over the globe. Well-known Investment banks, several central banks, and commercial companies are the main players in the Forex market.

The stock market has a mixed group of buyers and sellers of stocks which includes individual investors to big companies. As the name suggests, shares of a company are offered in a share market in terms of ownership. These transactions are typical, through stock exchanges. Most corporations choose to float their stock shares to raise capital. The stock exchanges provide the buyers and sellers with a clear, transparent, controlled, and convenient marketplace to trade.

Trading on such exchanges has traditionally been carried out by “open outcry”. But the trend toward electronic trading is high in recent years. However, it is not larger than the Forex market, which is the world’s largest financial market. When the Forex market is weighed against the stock market, the Forex market has more weightage. Why are we interested in the size? The most important factor is, that the bigger the Forex market, the higher its liquidity.


The volume comparison:

The size of the Forex market is one of the main disparities between Forex and Stocks. It is a focused trade on pairs like AUD-USD, USD-JPY, EUR-USD, and GBP-USD. The stock market value including all the world’s financial markets is about 200 billion dollars a day on average. A large amount of trading will offer traders many advantages. High volume means that traders can typically make their orders faster and nearer to their desired rates. Although, all markets are vulnerable to shortages, at any price point more liquidity. Allowing traders to enter and leave the market.


The Liquidity comparison:

A high-volume market normally has high liquidity. Liquidity results in narrower spreads and lowered costs in transactions. In contrast to stocks on the stock exchange, large Forex pairs typically have relatively small spreads and small transaction costs, which are one of the key benefits of dealing in the Forex market over the equity markets.


The trading timing comparison:

The Forex market is a 24-hour market and has no central location. There is always a part of the globe which has the market open and is during business hours. The trading of a listed stock is limited and has specific timings. Stock traders have to stick to stock exchange hours. Several major exchanges have however implemented some form of extended business hours. Stock traders may participate during times of pre-market and post-market trading. This was once only the area of institutional investors. The development of electronic trading has also made retail investors more accessible. Extended trading hours remain significantly low and non-liquid. When contrasting volumes over 24 hours, Forex is again winning. If you want to trade at any given time, it’s easy to compare the Forex market vs. the Stock market and the Forex market is the clear winner.


The No commission Forex market:

The main advantage of the Forex market is that it does not involve brokers and does not have any commissions. Spread is the difference between the purchase and sells price which is income to the Forex intermediaries. There is no broker’s charge in the Forex market. Even Forex intermediaries get benefits if they bear risks.


The Market focus comparison:

Perhaps a significant difference in Forex markets vs. Stocks markets is the aim of the trader. When you look at a single share in the stock market, you can focus on a relatively small selection of variables. While you may be aware of broader trends in the market, factors affecting the company will be the major look outlook out along with market forces in its specific sector will be more important. Relatively small factors will be of major importance such as the business debt levels, cash flows of the firm and earnings outlook, etc.

The focus is broader with the Forex market. A currency represents the entire economy’s aggregate performance. Consequently, Forex traders are more involved in macroeconomics. The emphasis will be more on general indicators such as unemployment in the country, inflation, and GDP than on the output of the particular sector. If you exchange a Forex pair, you trade two currencies simultaneously. A fundamental trader, therefore, contributes not only to the output of one country but also to two.


The conclusion:

The fact of the matter is that of trade is, always stick to what works and go for what fits best for you. If you understand more about one business than the other and have good knowledge about one business then, of course, you are more interested in individual firms and trading stocks will make sense for you. When you think more about macroeconomics, Forex market trading can be better for you. If you don’t have a specific habit but are conscious of transaction fees, Forex market trading might be the way to go.


Delta Corp – Chances of jackpot for investors increasing


Tarsons Products earned Rs. 29 crores in net profit.

Market update: 07th July 2022.

Market update: 07th July 2022. 

Overall performance:

Today as the market closed, SENSEX was up by 427.49 points or 0.80%, closing at 54178.46 and NIFTY was up by 143.10 points or 0.89%, closing at 16132.90. While the S&P BSE small-cap index closed at 25,568.55 and increased by 328.87 points or 1.30%. NIFTY Bank increased by 1.74% or by 596.05 points and closed at 34920.30. Similarly, Nifty IT also surged by 0.67% or 188.70 points and closed at 28196.30

The most active stocks traded today were Reliance, Titan Company, HDFC, and Tata Steel closed at Rs.23,88.10, Rs.127.50, Rs.1395.80, and Rs.900 respectively.


Global Indices and Commodities:

When the Indian market closed, DAX was trading at 12,776.97 up by 189.246points or 1.42%. NASDAQ was trading at 11361.85 and up by 39.61 points or 0.35% and CAC was trading at 4,5998.95, increased by 1.53% or 90.70 points. Currently, Gold is trading at 50,651 and increased by 151 points and 0.30%, and Silver is trading at 57,247 and gained 0.92%. Crude oil is trading at 7900, increasing by 1.73%.


Currency:

Currently, USD is trading at Rs 79.17, declining by 0.13%. EURO was trading at Rs 80.79 and increased by 0.36%. 

Sector-wise performance:

Today, almost all other sectors ended on a positive note. The IT Services & Consulting Service sector increased by 0.81%. However, some stocks in this sector fell, which are Affle India and Bartronics. Sectors such as Finance, Households, Paints, and Pharmaceutical increased by 7.57%, 9.93%, 4.79%, and 2.49% respectively. The oil exploration and production sector fell by 3.12%.

Top 5 gainers:

The top 5 gainers today were Titan Company, Tata Steel, Larsen, and Induslnd Bank, M&M. Titan Company (CMP Rs.2127.50), and Tata Steel (CMP Rs.900) increased by 5.66% and 4.88% respectively. The current market price of Larsen is Rs. 1611.10 and gained 3.53%. IndusInd Bank was up by 2.92% and closed at Rs.861.00. M&M gained by 2.60%. The CMP of the company is Rs.1133.30

Top 5 losers:

Today, the top 5 losers were Dr Reddys Labs, Nestle, Bharti Airtel, Reliance, and Bajaj Finance. Dr Reddys Labs (CMP Rs. 4,338.35) declined by 1.29% and Nestle (CMP Rs. 18,187) by 1.14%. Bharti Airtel closed at Rs. 686.65 and slipped by 1.05%. Reliance decreased by 1.01%. The closing price was Rs. 2387.65 as against the previous closing price of Rs. 2411.95. Bajaj Finance closed at Rs. 5859.90 and fell by 0.98%

Stock in news: 

Titan Company’s first-quarter sales jumped by 205% year on year basis. The closing price of Titan Company was Rs.2127.50 as against the previous closing price of Rs.2013.55. The price increased by 5.66%. The board of PBA Infra approved the voluntary delisting of shares of the company from NSE. The company’s share price fell by 2.61% and closed at Rs. 13.05. Deep IND received a Letter of Awards from ONGC. The company’s share price rallied from Rs.188.45 to Rs.198.50. The price increased by 5.33%.

Market update: 07th July 2022. 
Image shown is for representation only.

Adani Wilmar enters the coveted large-cap category by AMFI


Godha Cabcon & Insulation Reports Q1 2026 Results

Market update 16th June 2020. Market surges despite volatility. HDFC twins top gainers.

Market update 16th June 2020. Market surges despite volatility. HDFC twins top gainers.


Overall performance:

Today, Indian indices witnessed volatile trade due to improving performance of global cues and closed on a positive note. Selling pressure was seen in FMCG, Infra, Energy and Pharma stocks but IT and Metal stocks outperformed. When market closed, SENSEX increased by 376.42 points or 1.13%, closing at 33,605.22 and NIFTY was up by 100.30 points or 1.02%, closing at 9,914.00. The S&P BSE midcap index was up by 46.34 points or 0.37%, closing at 12,501.29 and S&P BSE Small cap increased by 4.77 points or 0.04 %, closing at 11,849.62. While, NIFTY Midcap 100 closed at 14,230.60, up by 62.05 points or 0.44% and NIFTY Small cap 100 closed at 4,404.75 and decreased by 4.85 points or 0.11%.


Global indices and commodities:

When Indian market closed, almost all the global indices were trading at a positive note. DAX was up by 328.98 points or 2.76%, trading at 12,240.33 and CAC was trading at 4,923.46, up by 107.74 points or 2.24%. SGX Nifty was trading at 9,881.50 and increased by 0.87% or 85.00 points. While, NASDAQ was trading at 9,726.02, up by 85.00 points or 0.87%.

Currently, Gold is trading at 47,350.00 up by 324.00 points or 0.67%, Silver is trading at 47,910.00 up by 517.00 points and 1.09%. Crude oil is trading at 2,859.00, which increased by 74.00 points or 2.66%.


Currency:

At the closing time of Indian indices, almost all the currencies were trading at a positive note. USD was trading at Rs 76.21, increased by 0.25%. EURO was trading at Rs 86.10, up by 0.13% and GBP was trading at Rs 96.21, up by 0.51%.


Sector wise performance:

Among the sectors, major jump was seen in Banking, Auto, IT, and Metal sector while major losses was booked by FMCG and Pharma Stocks. The S&P BSE Auto index increased by 9.74 points or 0.07% and S&P BSE BANKEX was up by 441.83 points or 1.95%. S&P BSE IT was up by 135.73 points or 0.95% and BSE IT was up by 135.73 points. NIFTY BANK increased by 383.80 points or 1.93%, closing at 20,296.70 and NIFTY Auto was up by 8.05 points or 0.12%. While, NIFTY IT increased by 54.10 points or 0.38%, closing at 14,450.80 and NIFTY FMCG fell by 126.45 points or 0.44%.


Top 5 gainers:

Share price of HDFC Bank increased by 40.55 points or 4.27%, closing at Rs 990.40, HDFC gained 70.25 points or 4.01% and closed at Rs 1,891.90. ICICI Bank shares increased by 11.85 points or 3.58%, closing at Rs 342.95. JSW Steel was up by 6.30 points or 3.43%, closing at Rs 190.05 and Hindalco shares increased by 4.30 points or 2.95% and closed at Rs 150.10.


Top 5 losers:

Today, Tata Motors shares declined by 5.75 points or 5.72%, closing at Rs 94.75. Bharti Infratel shares declined by 6.90 points or 3.10 percent, closing at Rs 216.00. Tech Mahindra decreased by 15.50 points or by 2.82%, closing at Rs 533.30. Share price of GAIL fell by 2.15 points or 2.16%, closing at Rs 97.50 and Axis Bank declined by 8.05 points or 2.07%, closing at Rs 381.55.


Stock in news:

Most active stocks in terms of volume were Vodafone idea, Tata Motors, SBI, IndusInd Bank, SAIL, Federal Bank, BHEL, IDFC First Bank, Bank of Baroda, Axis Bank, RBL Bank and PNB. Today, HDFC Twins were in news as both HDFC and HDFC Bank gained more than 4 percent. Tata Motors was in news as after they announced their Quarter 4 Results,. Their share price declined by more than 5 percent and was one of the top losers today, closing at Rs 94.75. IT sector ended on positive note and IT stocks like TCS and Infosys increased around 1 to 2 percent.


Market update 15th June 2020. Market closes on a negative note for third consecutive session.