
TVS Motor Company Limited – Q4 FY25 Financial Results Report
Executive Summary
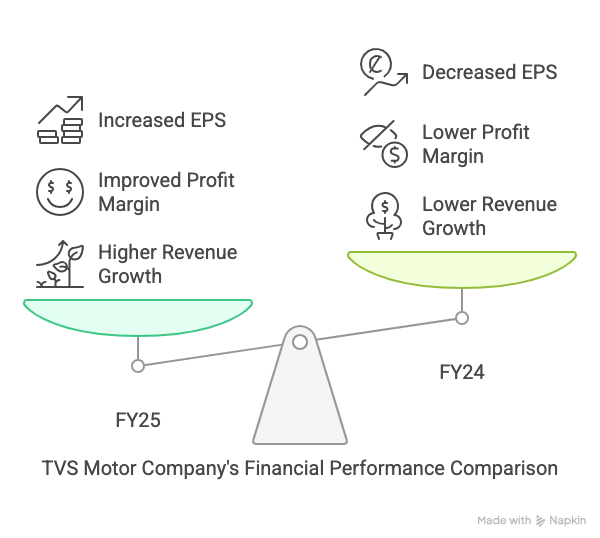
TVS Motor Company concluded FY25 with a robust financial performance marked by strong growth in revenues and profitability across both its automotive and financial services businesses. The company demonstrated operational resilience, disciplined capital allocation, and effective cost control, despite macroeconomic challenges. Consolidated revenue grew to over ₹44,000 crore, while net profit for the year stood at ₹2,379.81 crore—an increase of 33.7% over FY24. The company declared an interim dividend of ₹10 per share (1000%) earlier in March 2025.
Consolidated Financial Highlights – Q4 FY25
| Metric | Q4 FY25 | Q4 FY24 | YoY Growth |
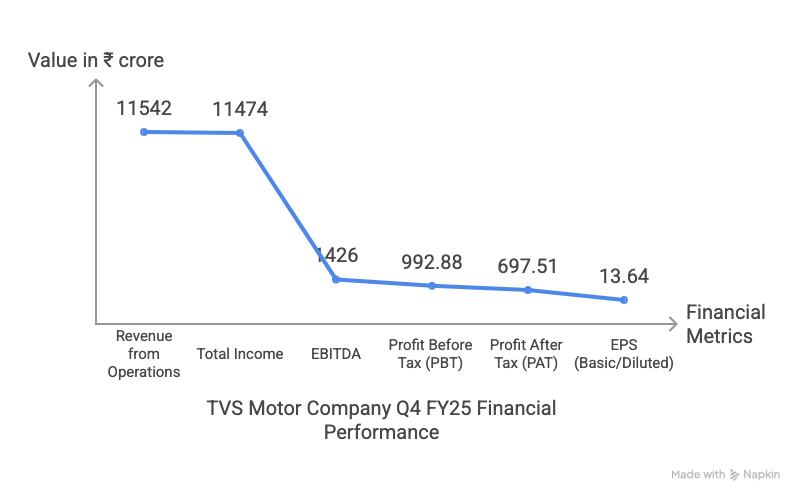
| Revenue from Operations | ₹11,542 crore | ₹9,942 crore | 16.1% |
| Total Income | ₹11,474 crore | ₹9,899 crore | 15.9% |
| EBITDA (approx. from margins) | ₹1,426 crore | ₹1,020 crore | ~40% |
| Profit Before Tax (PBT) | ₹992.88 crore | ₹637.35 crore | 55.8% |
| Profit After Tax (PAT) | ₹697.51 crore | ₹411.53 crore | 69.5% |
| EPS (Basic/Diluted) | ₹13.64 | ₹8.15 | 67.4% |
Profit includes ₹10.81 crore from discontinued operations related to divested divisions in a subsidiary.
Full Year Consolidated Performance – FY25
| Metric | FY25 | FY24 | YoY Growth |
| Revenue from Operations | ₹44,089.01 crore | ₹38,778.82 crore | 13.7% |
| Total Income | ₹44,158.57 crore | ₹38,884.64 crore | 13.6% |
| EBITDA Margin | 10.8% | 9.9% | +90 bps |
| Net Profit After Tax | ₹2,379.81 crore | ₹1,778.54 crore | 33.7% |
| Net Profit Margin (%) | 5.4% | 4.5% | +90 bps |
| EPS (Basic/Diluted) | ₹47.05 | ₹35.50 | 32.5% |
Segmental Performance (FY25)
A. Automotive Vehicles & Parts
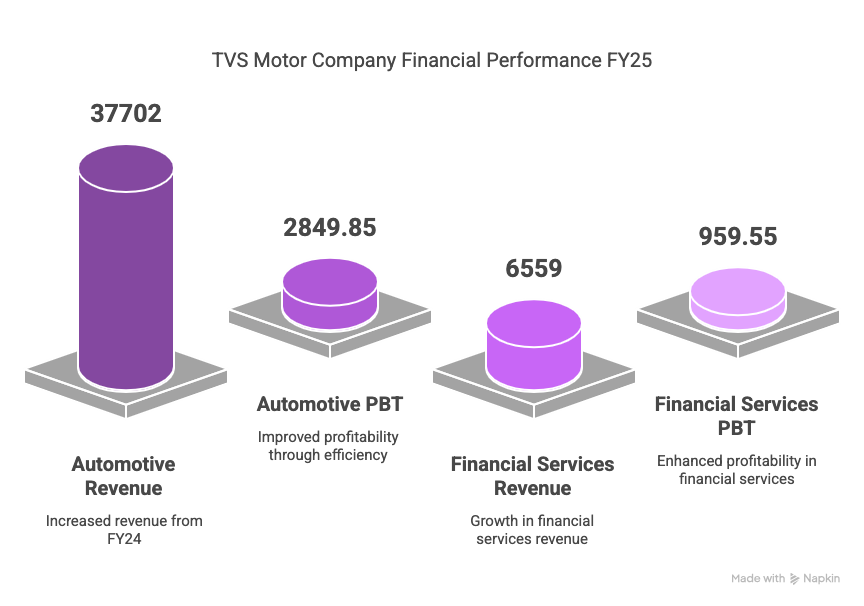
The company reported revenue of ₹37,702 crore, up from ₹33,188 crore in FY24. Profit Before Tax (PBT) stood at ₹2,849.85 crore. Operating leverage improved through volume growth and cost optimization
B. Financial Services
The company’s revenue climbed to ₹6,559 crore in FY25, marking an increase from ₹5,791 crore in the previous fiscal year. Profit Before Tax (PBT) stood at ₹959.55 crore. Interest service coverage improved to 14.57x, compared to 10.53x in FY24.
 Key Operational Metrics
| Metric | FY25 | FY24 |
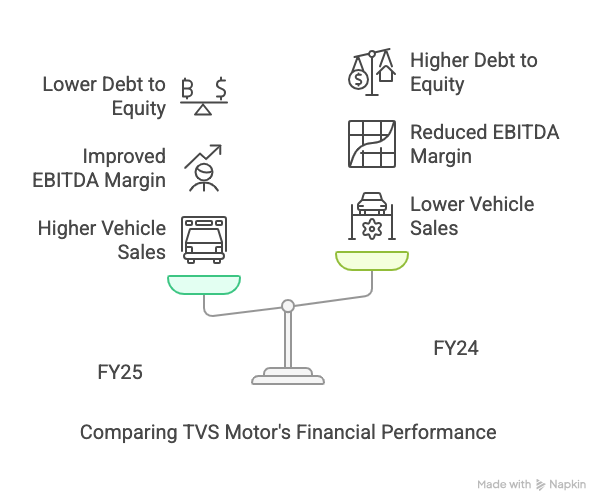
| Vehicle Sales Volume | 47.44 lakh units | 41.91 lakh units |
| EBITDA Margin | 10.8% | 9.9% |
| Net Debt to Equity (Consolidated) | 2.76x | 3.38x |
| Debtors Turnover | 24.8x | 25.3x |
| Inventory Turnover | 11.5x | 11.7x |
 Cash Flow Highlights (FY25)
| Particulars | Standalone (₹ Cr) | Consolidated (₹ Cr) |
| Net Cash from Ops | 4,266 | 3,503 |
| Net Cash from Investing | (3,871) | (2,899) |
| Net Cash from Financing | (587) | 1,155 |
| Net Change in Cash | (192) | 1,759 |
| Closing Cash Balance | ₹294 crore | ₹4,115 crore |
Notable Updates
The FY25 PLI incentive was accounted for in accordance with the Standard Operating Procedure (SOP) established by the Ministry of Heavy Industries (MHI). A fair value loss of ₹89.08 crore was recorded in Q4 due to the revaluation of investments. Additionally, the company undertook subsidiary realignment, which included divestment in ION Mobility and other associates, the addition of new subsidiaries such as DriveX Mobility, and the reclassification of certain divisions like Injection Moulding and Seating as discontinued operations.
Balance Sheet Snapshot (Consolidated)
| As on 31st March 2025 | ₹ Crore |
| Total Assets | ₹47,937 |
| Total Equity | ₹9,442 |
| Total Liabilities | ₹38,495 |
| Net Worth | ₹8,481 |
| Total Borrowings | ₹27,616 |
- Asset base supported by investments in EVs, overseas businesses, and finance arms
- High cash reserves: ₹4,115 crore (Consolidated)

Subsidiaries & Global Footprint
TVS Motor’s consolidated results include contributions from its Financial and Mobility Services segment, comprising TVS Credit, DriveX, Harita ARC, and TVS Housing Finance. The company’s global operations extend across India, the UK, Europe, Indonesia, Singapore, and Dubai
Outlook
TVS Motor continues to execute a strategic blend of traditional ICE vehicle dominance with electric mobility investments. International subsidiaries, financial services, and product innovation across the value chain remain key drivers for FY26. With reduced debt leverage, strong free cash flows, and operational discipline, the company is well-positioned for future resilience and expansion.
The image added is for representation purposes only


LEAVE A COMMENT
You must be logged in to post a comment.